
Media monitoring tools often include automated reports to help you visualise and understand coverage. We have a number of these automated analysis reports built into Fuseworks. Sometimes though, you need to delve deeper into the data – and automated reports can fall short.
Our approach to helping clients take their media analysis to the next level, has been to provide a flexible tagging and sentiment tracking tool, which means what you can report on, is really only limited by your imagination.
Some of the Fuseworks generated reports our clients have shared with us over the years are awe inspiring in their level of sophistication. They are also of course, confidential to the customer – which is a bit of a problem when you need to provide examples of the sorts of reports you can create.
So we thought we’d use a bit of quiet time in early January to create our own analysis report – which showcases a small slice of the type of information you can uncover with Fuseworks.
Last week marine reserves were in the news – so we had a look back at coverage over time, from the perspective of an organisation that’s engaged on the issue. Forest and Bird has been campaigning for years for more reserves – so we put ourselves in their shoes to develop an approach to tracking coverage of the issue, from their perspective (or at least from their theoretical perspective, based on our own, independently formulated assumptions)…
Choosing what to track
Since you can track anything you want – the hardest thing to do is often to decide what’s important enough to report on. As a rule of thumb – if you can’t use the information you’re creating to help define actions and reward success, then it’s probably not worth the effort.
We decided we were interested in three things:
- The importance of the media outlets which generated relevant mentions
- The prominence of Forest and Bird in each story, and;
- Whether the story was positive, negative or neutral in its likely effect on Forest and Bird’s campaign for an expansion in the number of marine reserves.
Everything is subjective
Some of these three measures are more subjective than others – but they’re all subjective. That’s why automated reporting tends not to be a good match for organisations that really want to understand media coverage in depth.
Even something like the ‘importance of media outlets’ can seem like it might have an objective measure at first glance (number of readers/viewers/listeners etc) – but within every reporting decision there are shades of grey that need to be defined by the organisation doing the reporting.
For example, a small trade publication may have a minimal audience and be low importance to most organisations – but it could also be of critical importance to a handful of groups who care very deeply about reaching the small audience catered to by a particular publication.
Equally, reaching the large audience of RNZ’s Morning Report is a big win for many – but meaningless, if the people you need to reach aren’t listeners.
Thinking beyond big numbers
We also try to counsel our customers against getting seduced by the large but meaningless numbers. It’s common in media monitoring to assign a ‘value’ to coverage based on a combination of top level readership stats (or ‘derived’ stats) and rate card advertising prices for media outlets.
If you’ve ever seen internal audience metrics from a media outlet (a closely guarded secret, if the information is available at all), or ever purchased an advertisement – you know that the audience for a particular story is a fraction of a fraction of total publication/show audience – and no-one pays rate card prices for advertising.
While you could use Fuseworks to assign values to particular articles and then add them up – in reality no one does that. We think the reason is simply that the flexible tagging system is a great opportunity to think strategically about what metrics really matter to your organisation – and to create bespoke metrics that help deliver genuine return on investment from your media monitoring.
What we decided mattered
For our reporting, we decided it would be valuable to group the data in the following ways:
Media outlets:
- Tier 1 media (national)
- Tier 2 media (regional)
- Tier 3 media (community)
- Tier 4 media (aggregator)
- Tier 5 media (blog)
In this example we care very deeply about mentions in tier 1 media and tier 5 is interesting, but not really valuable to us.
Forest and Bird prominence:
- F&B central to story
- F&B quoted
- F&B passing mention
F&B Marine Reserves campaign:
- Positive
- Neutral
- Negative
The results
Having done a search in Fuseworks for articles about marine reserves that also mention Forest & Bird, it was just a matter of quickly looking through the results and assigning the tags we’d defined. From there you can create a graph like this one:
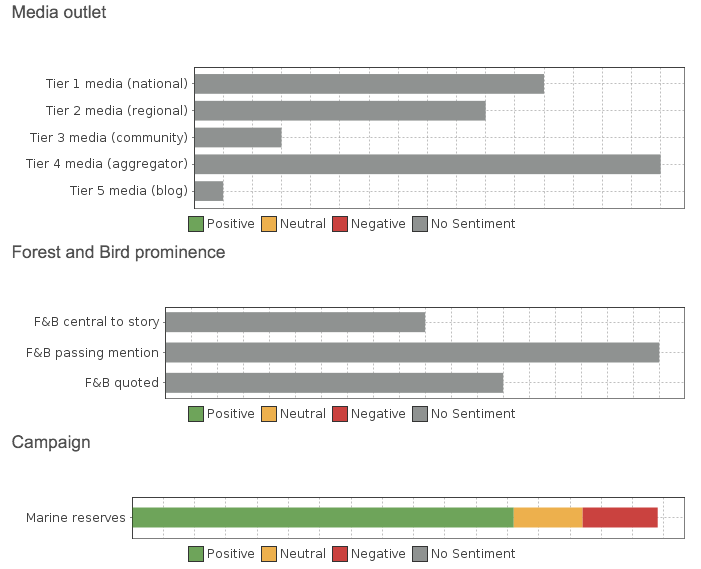
From the graphs above we can see coverage on the marine reserves issue has been largely positive (from the perspective of Forest and Bird) and that their campaign ensured their organisation was central to the story, or was quoted, in a good percentage of stories.
But how does the story look over time? To find out, we exported the raw data out of Fuseworks in a CSV format and then created a few graphs:
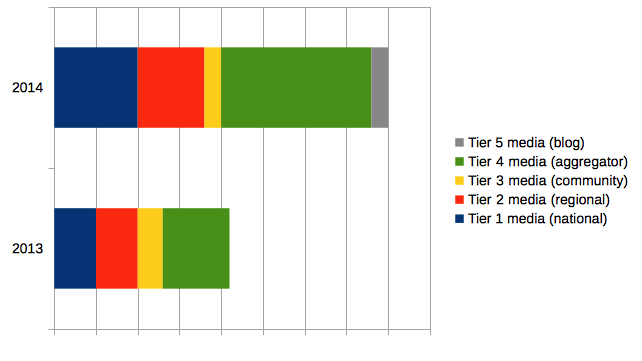
This shows a growth in media mentions across years, across all media types – but particularly in top tier media and on aggregator sites.
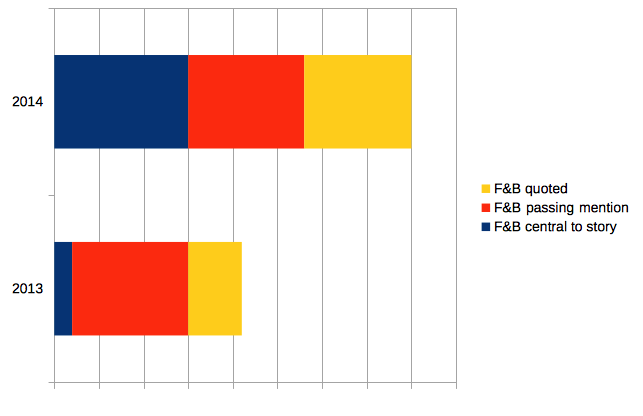
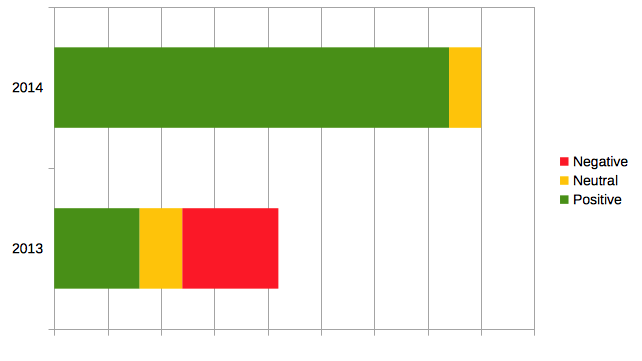
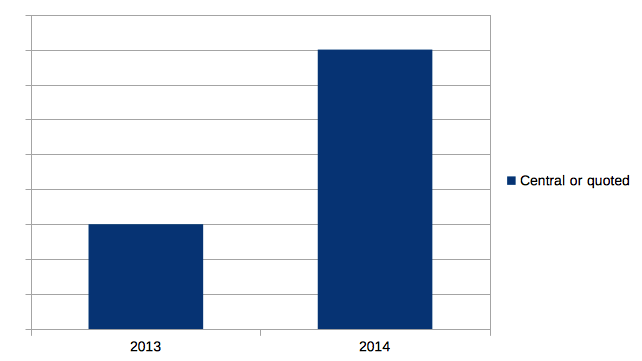
Again, the data suggests strong growth from year-to-year in stories where F&B was central or quoted and the graph below shows a major increase in stories positive to the campaign, between years.
Once you start reporting in this sort of way, you quickly find yourself both captivated by the sorts of things you can discover and the types of questions you can answer.
All of the tag information is also available via the search engine in Fuseworks (but only to the organisation that creates the tags) – so you can combine data in fascinating ways.
ie: while the graph above shows a big increase in stories from year to year where Forest and Bird was either central to the story, or quoted – how does the graph look if you are most interested in stories that appear in top tier media?
Quite positive it turns out:
Unleash your imagination and get tagging – and if you need a bit of help to get started, just check out the guide in the support centre or reach out to your account manager. They’ll be happy to help.
For more inspiration check out this alternative approach to using tagging.
You must be logged in to post a comment.